
#Mobility #Berlin
Mobility Dashboard
Focus:
Mobility
Target group:
Members of the Berlin public
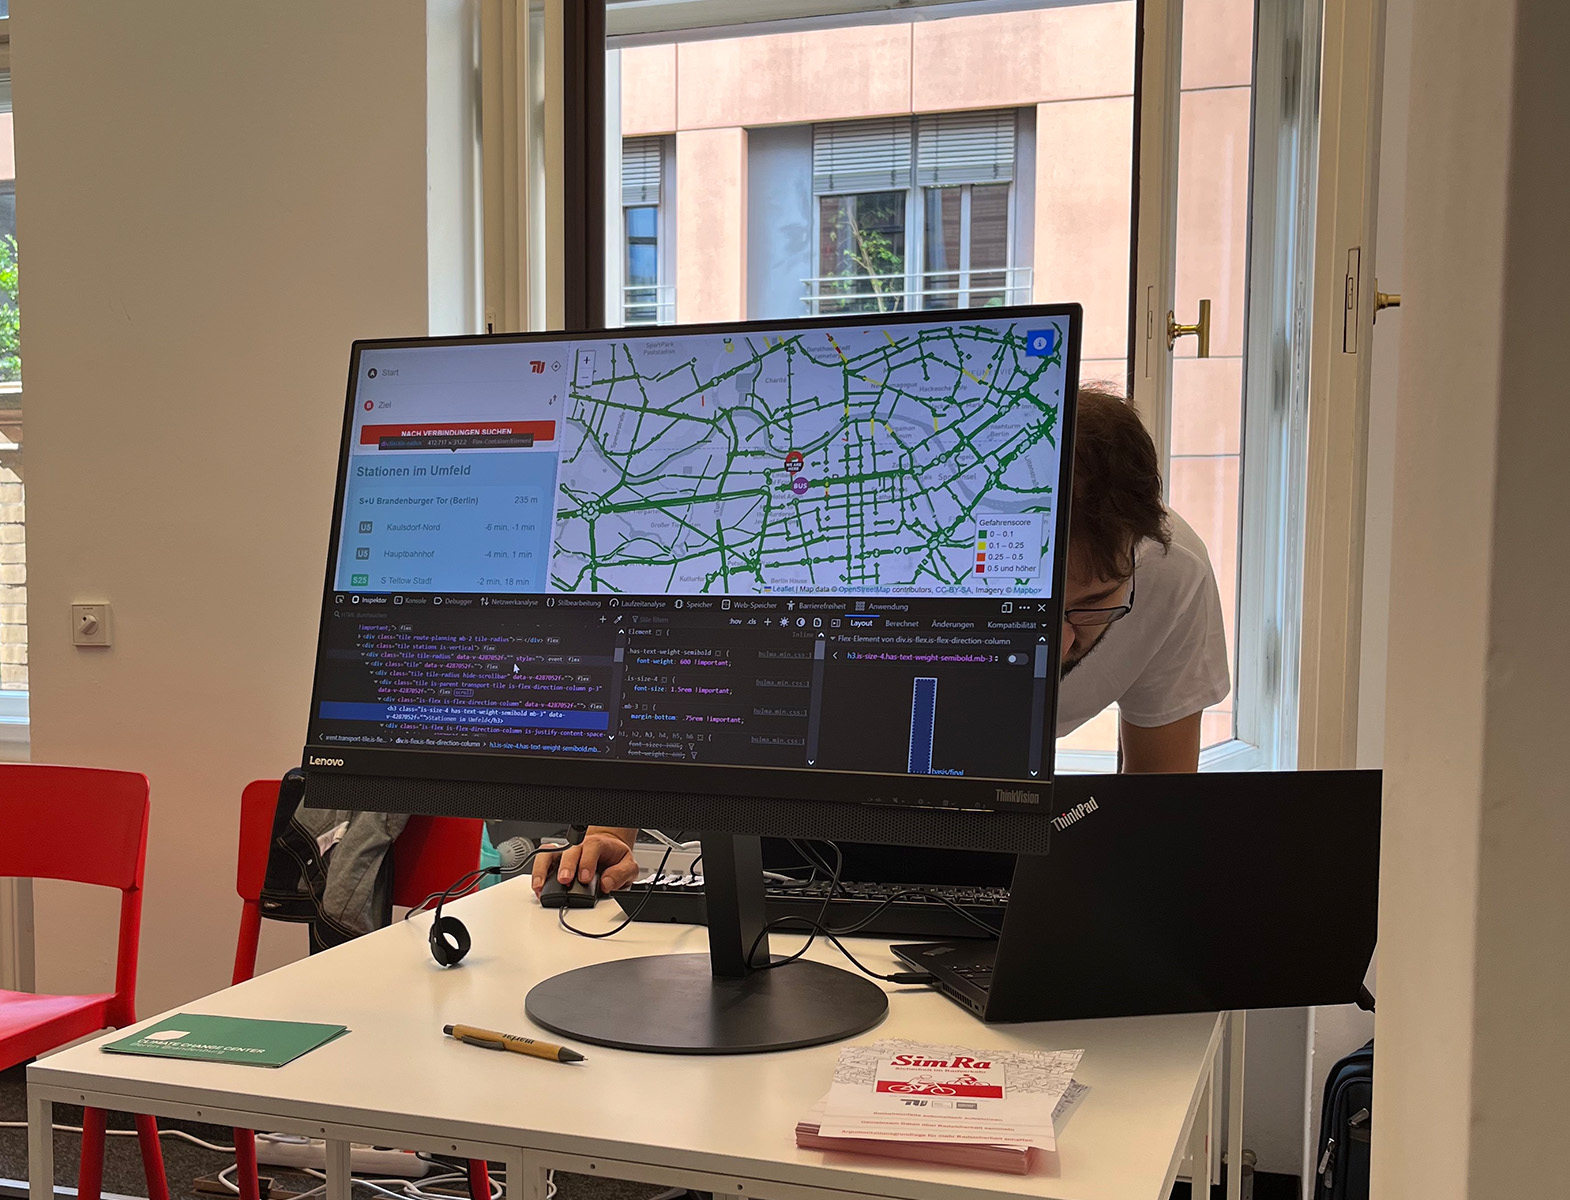
The Mobility Dashboard shows various options for planning routes in Berlin as well as the carbon emissions the journey generates. The options presented include public transit, cycling, walking, micro-mobility, car sharing, and private cars. In addition, real-time weather updates (nowcasting) and information about hazardous sections of cycle paths are integrated into the web application. This enables users to choose the most suitable route for them, including in terms of climate protection.
You can access the Mobility Dashboard via your browser. You can then enter your starting point and destination and search for various routes. The options for different types of transport are presented in no particular order. This allows you to make your own decision based on carbon emissions, the weather, and the time it takes to reach your destination.
The Mobility Dashboard was developed at TU Berlin. The aim of the project is to present different transport alternatives for specific routes, to highlight the resulting climate impact, and to make eco-mobility options more convenient to use by linking different information.
As part of the web application, the various public transport stops serving the TU campus were pooled as a virtual stop in order to provide users with the quickest route or more convenient alternatives. It is also possible to extend the app to include other TU Berlin sites.
Following on from a report on regional television (rbb-Abendschau), work is now being carried out together with Berliner Verkehrsbetriebe (BVG) to integrate some of the features of the Mobility Dashboard, such as the resulting carbon emissions, into the BVG’s “Jelbi” app.
© Birgit Holthaus